


Safety
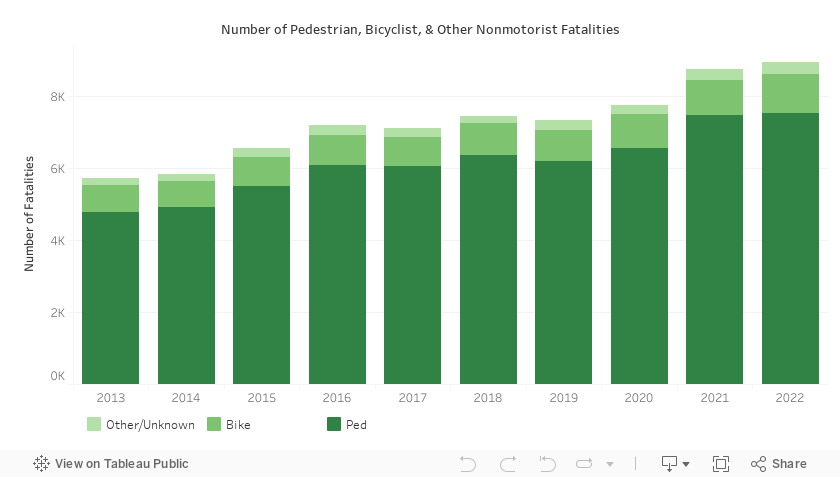
In 2021* there were 7,388 pedestrians, 966 bicyclists, and 295 other nonmotorists (e.g. persons riding micromobility devices) killed in crashes with motor vehicles in the United States. Together these road users account for a growing share of total US traffic fatalities: in 2012, pedestrians, bicyclists, and other nonmotorists represented 17.1 percent of total traffic fatalities, and in 2021 they accounted for 20.1 percent of fatalities.
Nonmotorist fatalities increased by 49.6 percent in the ten-year period between 2012 and 2021. During that same time period, total traffic fatalities increased by 27.1 percent.
*National Highway Traffic Safety Administration. (2023, April 3). Fatality and Injury Reporting System Tool (FIRST): 2012-2021 Final File and 2021 Annual Report File (ARF). Version 5.5. Retrieved April 11, 2023, from https://cdan.dot.gov/query.
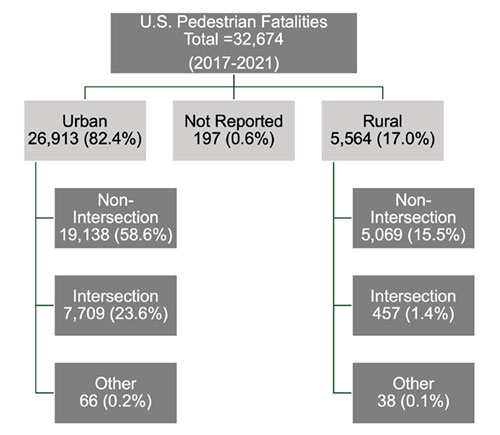
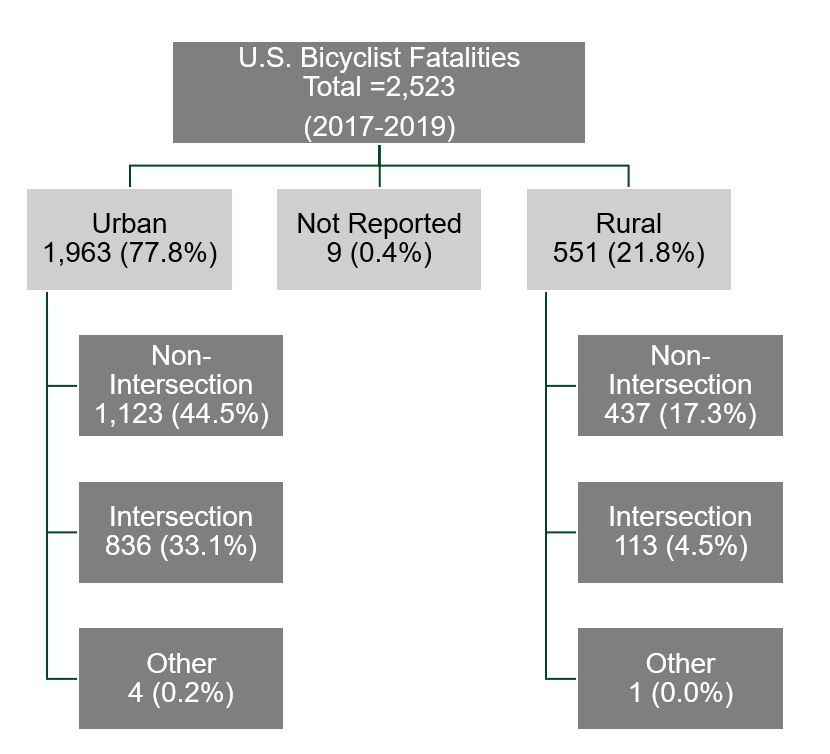
Over a five year period from 2017-2021, at a national level, the majority of pedestrian fatalities (74.1 percent) and bicyclist fatalities (50.7 percent) occur at non-intersections.
Lighting conditions are a major factor in pedestrian fatalities: 75.6 percent of pedestrian fatalities nationwide occur in dark conditions. By contrast, 48.2 percent of bicyclist fatalities occur in dark conditions. Time of day plays a role in this as well. The hours from 6:00pm to 11:00pm tend to account for more pedestrian and bicyclist fatalities than other times of day.
NHTSA Fatality and Injury Reporting System Tool reports on pedestrian and bicyclist injuries at the national level, using estimates each year from the from the Crash Report Sampling System (CRSS). In 2021, 60,577 people were injured while walking, and 41,615 people were injured while biking, an 11 percent increase and 7 percent increase respectively from 2020.
Studies have shown that pedestrian and bicyclist fatalities represent only the "top of the iceberg" with respect to all crashes involving these modes. Furthermore, research has demonstrated consistent underreporting of crashes involving pedestrians and bicyclists, so as many as 44-75 percent of pedestrian crashes and 7-46 percent of bicyclist crashes may be missing from police-reported crash data. In a recent study examining North Carolina pedestrian crash characteristics, investigators found that for each pedestrian fatality, 17 pedestrians were reported to have been involved in a non-fatal motor vehicle crash and 24 pedestrians were treated for their injuries in an emergency department setting.
Where to Find Data
- National data about traffic fatalities and injuries can be found through the NHTSA Fatality and Injury Reporting System Tool (FIRST), which allows customized queries from the the Fatality Analysis Reporting System (FARS) and from the Crash Report Sampling System (CRSS) .
- NHTSA Overview of Motor Vehicle Traffic Crashes in 2021 offers summary and analysis of crash, fatality, and injury data and other trends.
- Reach out to contacts in your State to learn more about data availability and trends in your area of the country.
- Toward a Shared Understanding of Pedestrian Safety: An Exploration of Context, Patterns, and Impacts provides background context on pedestrian safety issues and risks, crash patterns and contributing factors, and resulting impacts.