


Forecasting Pedestrian and Bicycle Travel Demands Using Travel Demand Model and Mode Share/Trip Length Data
Portland, Oregon / Vancouver, Washington
Source: Pedestrian and Bicycle Information Center (PBIC)
Problem
Transportation planners needed to forecast pedestrian and bicycle travel demand for twenty-three years in the future, over the Columbia River on the Interstate 5 bridge between Portland, Oregon and Vancouver, Washington.
Background
The Columbia River Crossing is a bridge, transit, and highway improvement project for five miles of Interstate 5 from State Route 500 in Vancouver to Victory Boulevard in Portland (see Figure 1). The Columbia River Crossing's purpose and need statement aims to address six transportation deficiencies in the corridor. Improving the existing substandard pedestrian and bicycle facilities across the Columbia River is one of these six goals.
The forecasting methodology was developed in partnership with the members of the Columbia River Crossing Pedestrian and Bicycle Advisory Committee (PBAC). PBAC members included representatives from Washington, Oregon, Portland, and Vancouver departments of transportation, as well as representatives from several local non-profit advocacy organizations. Input and feedback on the forecasting methodology and results were solicited from the group throughout the process.
Portland is one of the leading cities in the nation in the percentage of residents that walk and bicycle to work and was the first large city to be awarded the Platinum-level Bicycle Friendly Community designation from the League of American Bicyclists in 2008. Vancouver has also made enormous strides in their bicycle infrastructure development, increasing the size of their bikeway network from zero to 74 miles of bikeways in the last ten years. Vancouver received the bronze-level Bicycle Friendly Community designation in 2005. Only seven miles separate downtown Vancouver and Portland, and the current Columbia River Crossing corridor serves as the weak link in the bicycle network that connects the two cities.
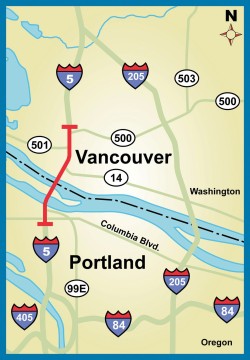
Figure 1: Columbia River Crossing Project Area.
Solution
Two data sources formed the base of the methodology used to develop the pedestrian and bicycle forecasts. The first data set consisted of mode share information from the US Census for the Portland-Vancouver metro area. The data contained the percentage of commute trips, made by walking and bicycling, in five-minute increments. Travel times were converted to travel distances by estimating average walking and bicycling speeds.
The result was a matrix of walking and bicycling mode share organized into one-mile increments. The mode share data was checked for accuracy by comparing it against a large, self-collected, commuter data set from the Bicycle Transportation Alliance, a bicycling advocacy organization, and data from a bicycling research project at Portland State University.
The second data set consisted of outputs from Metro's (Portland's metropolitan planning organization) regional travel demand model. A matrix was developed that contained the number of trips on the Interstate 5 bridge during both four-hour peak travel periods, by trip length in one-mile increments.
Pedestrian and bicycle forecasts for the Interstate 5 bridge were developed by multiplying the matrix of mode share data with the matrix of travel demand data. The process was first conducted with existing condition data; this produced results that were quite similar to actual count data, therefore validating the methodology.
Based on suggestions and feedback from the PBAC, several mode share scenarios were modeled. This was done in order to develop a forecasting range that would take into consideration future changes in land use patterns, population and employment densities, commuting behaviors, and environmental, social, and economic factors.
Results
Two scenarios for forecasting future pedestrian demands were modeled. The first scenario maintained the region's existing mode share for walking trips. The second scenario increased the mode share, for all trip distances, by 50 percent (Figure 2). Because most pedestrian trips are short in length, the biggest impact from this increase in mode share was seen for walking trips that are two miles or less in length. The model resulted in a pedestrian travel demand forecast over the bridge between 600 and 1,000 daily walkers (Figure 3).
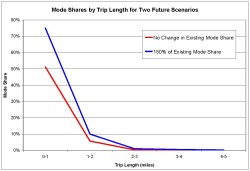
Figure 2: Pedestrian Mode Share Scenarios.
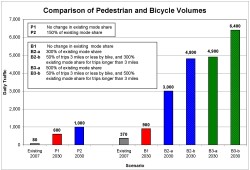
Figure 3: Comparison of Pedestrian and Bicycle Volumes.
The forecasted volume range represents a significant increase of the existing condition total of 80 daily pedestrians. Increases in employment and population density in downtown Vancouver, new waterfront recreational opportunities on the Columbia River, and a bridge toll may be some of the components of the future forecasted increase in pedestrian demand on the new bridge.
Five different scenarios for bicycle forecasts were analyzed (Figure 4). They produced a future forecast range for daily bicycle travel over the new bridge between 900 and 6,400 daily riders, significantly up from the 370 riders today (Figure 3). The low end of the range is a scenario in which the mode share, by distance, does not change from today. The scenario that maintains today's mode share, but allows for 50 percent of short trips (less than three miles long) to be made by bicycle would experience daily ridership of 3,000.
A scenario in which the mode share grows to the point that it reflects current conditions on the Hawthorne Bridge, Portland's busiest section of its bicycle network, would result in 4,800 daily riders. A fourth scenario, which combines the short trip provision along with a mode share reflecting bicycle usage on the Hawthorne Bridge today, would see daily ridership of 4,900.
Accounting for attractiveness of the Hawthorne Bridge bicycle route derived the 300% mode share curve shown in Figure 4. This was confirmed by comparing the calculated values against existing City of Portland bridge July 2007 count data. The 300% curve closely predicted the bi-directional, four-hour peak AM volume over the Hawthorne Bridge. The model produced a four-hour count of 1,600 bicyclists, six percent less than the actual count of 1,700 bicyclists.
Finally, a scenario that takes into account the ambitious mode share goals of the City of Portland produced a forecast of 6,400 daily bicyclists.
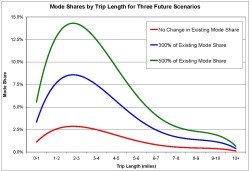
Figure 4: Bicycle Mode Share Scenarios.
Conclusion
Travel demand forecasting model data, combined with actual mode share/trip length data, can be used to develop reasonable projections of pedestrian and bicycle demands. Robust and well-calibrated travel demand models are critical to the process and should include refined traffic analysis zones and forecasts of person-trips for multiple hour periods. Regional pedestrian and bicycle mode share data, backed up with recent surveys, are also a key element. It is important to validate pedestrian and bicycle forecasts with current counts on existing facilities to assure a reliable model.
The Portland-Vancouver region is now using the tools described in this paper to develop pedestrian and bicycle forecasts for several proposed regional multi-modal projects. The process can be successfully applied to pedestrian and bicycle projects proposed in other regions.
Contact
David Parisi, PE, TE
Columbia River Crossing Project
Principal, Parisi and Associates
david@parisi-associates.com
415-786-8978
Zachary Horowitz
Columbia River Crossing Project
Transportation Planner, David Evans and Associates
zah@deainc.com
503-499-6663