North Carolina Pedestrian and Bicycle Crash Data Tool
Help for Crash Data Tool
Crash Data Resources and Processing
The data represent all bicycle- and pedestrian-motor vehicle crashes reported to the NC Division of Motor Vehicles by investigating police officers. A new year of data is added each year. Bicycle- and pedestrian-motor vehicle crash forms are obtained from the NC Division of Motor Vehicles (DMV). These are closely examined, particularly the investigating officer’s sketch and narrative description. Upon review of the crash form, a specific crash type (e.g., bicycle ride out or pedestrian dart out) is developed using Pedestrian Bicycle Crash Analysis Tool (PBCAT) and added to the database. Users accessing the crash data tool are able to develop tables for a number of variables.
Falls or other events involving only bicyclists and pedestrians that might be documented in medical databases are not included. While past research indicates that bicycle-motor vehicle crashes represent approximately 20-30% of all injuries to bicyclists and pedestrian-motor vehicle crashes represent approximately 30-40% of all injuries to pedestrians, it is clear that most of the serious and fatal bicyclist and pedestrian injuries do involve motor vehicles.
Glossary
General Terms
Crash Facts — Crash Facts refers to information or tables that are derived from the standard crash reporting form for the State of NC. These forms are retained by the NC Division of Motor Vehicles. For example, when a bicyclist or pedestrian is struck by a motor vehicle, information available in this crash data tool pertaining to the age, race, injury severity, etc. of the bicyclist or pedestrian is taken directly from the crash form data. The same would be true for type of roadway, speed limit, etc. The user of this crash data tool may choose from a list of Crash Fact variables to obtain tables. There are links to a NC Bicycle Crash Facts Summary Report and a NC Pedestrian Crash Facts Summary Report within this crash data tool web site. These provide summaries of the latest five years of available data.
Crash Types — Crash Types refers to information or tables that are based on a review of the standard crash reporting form and then supplemented with a crash type code using Pedestrian Bicycle Crash Analysis Tool (PBCAT). An example of a bicycle crash type is ride out from driveway, and an example of a pedestrian crash type is dart out into the street. The user of this crash data tool may choose from a list of Crash Type variables to obtain tables.
There are links to a NC Bicycle Crash Types Summary Report and a NC Pedestrian Crash Types Summary Report within this crash data tool web site. These provide summaries of the latest five years of available data.
More information, definitions and images of the crash types, and examples from communities that have used PBCAT, along with other resources, are available at www.pedbikeinfo.org/pbcat_us/index.cfm The software and user manual are available for free download at the same site.
Data Query — This feature allows users to develop their own tables for bicycle- or pedestrian- motor vehicle crashes. The user of this crash data tool may select from choices for geographic location (e.g., statewide or a particular county or city) and years (1997-2015), and further determine the table structure (one-way table or two-way table), as well as the variables for table rows and columns.
Search Guide
In the Crash Data Tool, there are two ways to get the data tables you need. You can either look for existing crash data tables or create a table with specific variables structured for your research interests. The searching methods are comparable across the section of bicyclist data and the section of pedestrian data. In this manual, all screenshots are taken from the section of bicyclist data.
Crash Data Tables
Find a table by selecting the location, the years and the table type.
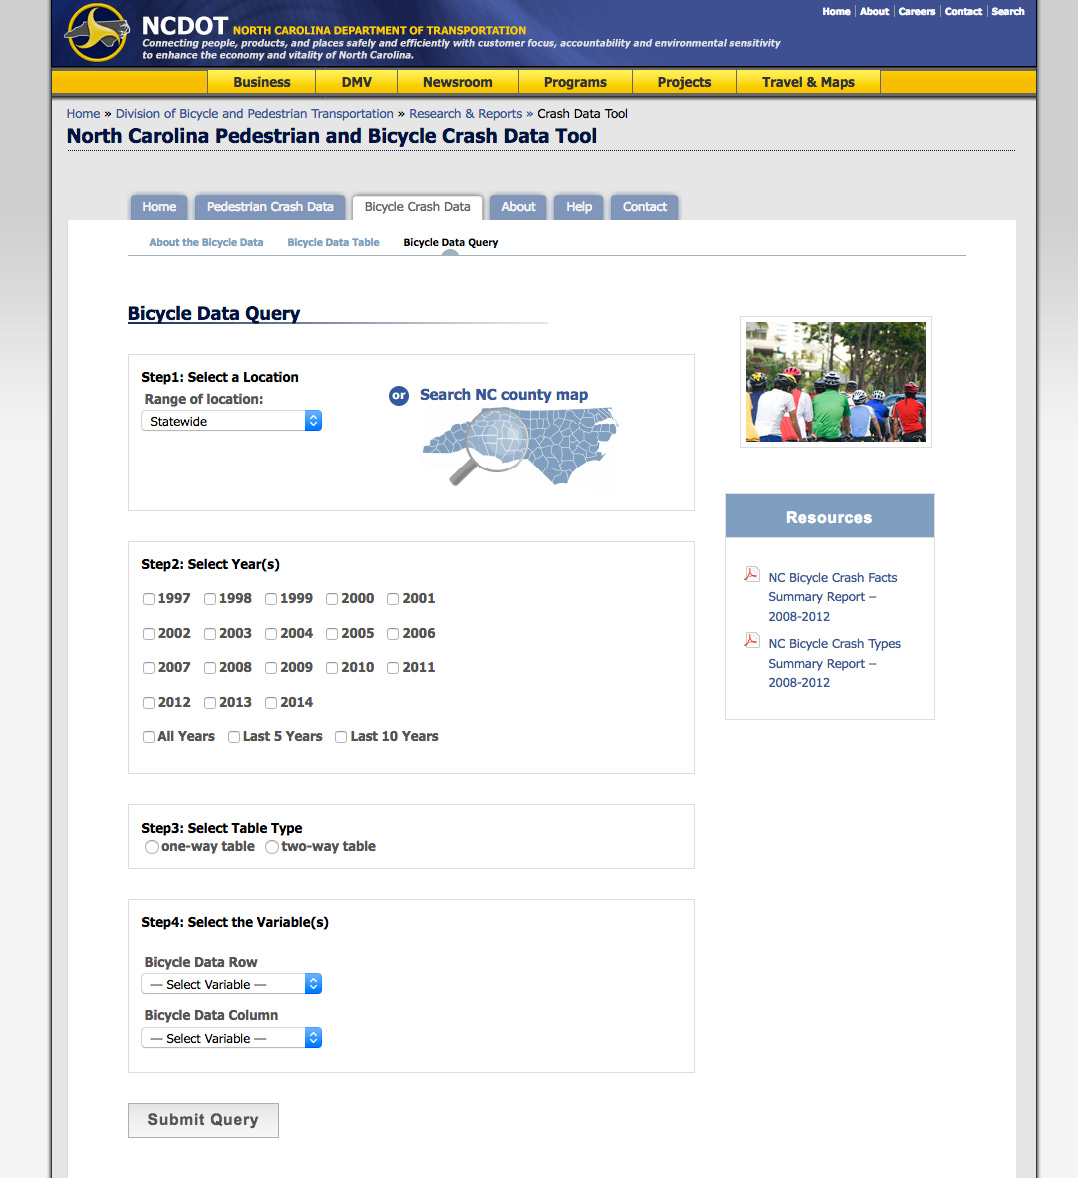
Step1: Select Location
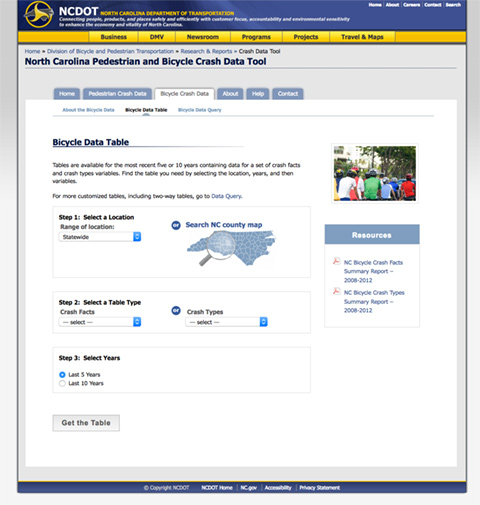
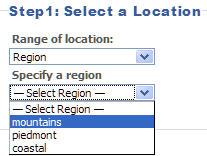
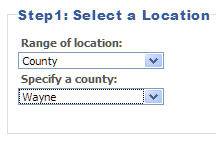
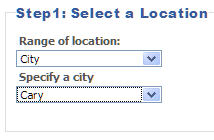
The Crash Data Tool contains data tables of three hierarchical geographic levels of North Carolina (NC) — the region, the county, and the city.
- The default selection for "Range of location" is Statewide.
- If you need data about a region, upon your selecting "region" in the Range of Location list, a select box of regions will appear underneath, in which you specify a region, i.e. Mountains.
- If you need data about a county, upon your selecting "county" in the Region list, a select box of counties will appear underneath, in which you specify a county name.
- If you need data about a city, upon your selecting "city" in the Region list, a select box of cities will appear underneath, in which you specify a city name.
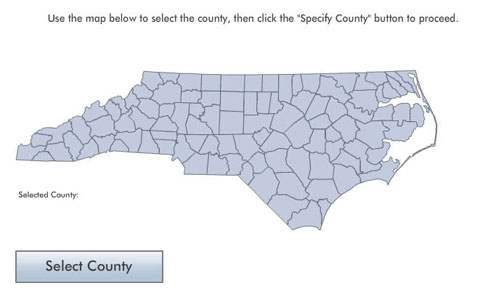
— The Crash Data Table Tool also features the NC image map for your location search. If you open the NC image map by clicking the map icon, you could pick a county from the map, hit the button "Select County", and your selection will be automatically populated and reflected in the selection box.
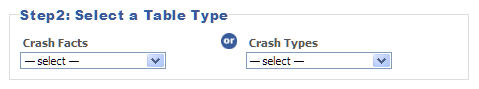
Step2: Select a Table Type
The data tables contained by the Crash Data Tool can be either about crash facts or crash types. Please specify a crash fact or a crash type in the pertinent select box.
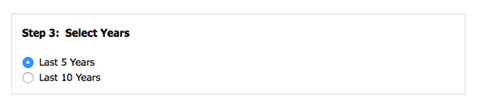
Step3: Select Years
Choose a date range for the table.
Click "Get the Table" button to retrieve the data table.
Data Query
Create a table by selecting the location and years and then determining its type (one-way table or two-way table) and the variables to populate the table.
Step1: Select Location
The Crash Data Query Tool can be used to create data tables for three hierarchical geographic levels of North Carolina (NC) — the region, the county, and the city.
- The default selection for "Range of location" is Statewide.
- If you are interested in the data for a NC region, simply make your choice in the Region list, i.e. Mountains.
- If you need data about a county, upon your selecting "county" in the Region list, a select box of counties will appear underneath, in which you specify a county name.
- If you need data about a city, upon your selecting "city" in the Region list, a select box of cities will appear underneath, in which you specify a city name.
— The Crash Data Query Tool also features the NC image map for your location search. If you open the NC image map by clicking the map icon, you could pick a county from the map, hit the button "Select County", and your selection will be automatically populated and reflected in the selection box.
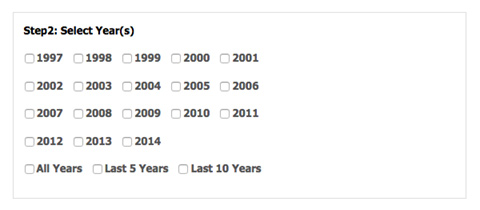
Step2: Select Years
You can choose one year or multiple years of the data for your table by clicking relevent check box(es). If you need data for all the listed years, a shortcut is to check "Select All Years".
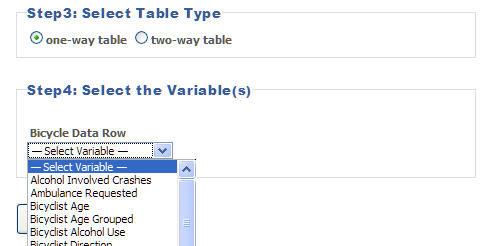
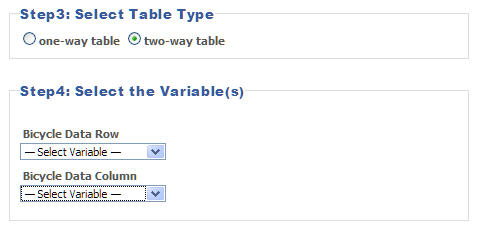
Step3 & Step4: Select Table Type (one-way table or two-way table) and then variables
The table you are creating can be either a one-way table or a two-way table depending on your data needs.
- If you need a one-way table, please choose a variable for the row of your table. If you select a one-way table, the data for that variable will be displayed in columns by the selected crash years.
- If you need a two-way table, please specify variables for both the row and the column of your table. If you select a two-way table, the data will be summed for all crash years selected, and displayed in a cross-tabulation table for the two variables selected.
Click "Submit Query" button to retrieve the data query.
Need Help?
UNC Highway Safety Research Center
Libby Thomas
libbyt@email.unc.edu
(919) 962-7802
NCDOT Division of Bicycle and Pedestrian Transportation
John Vine-Hodge
javinehodge@ncdot.gov
919-707-2607
- © Copyright NCDOT
- NCDOT Home
- NC.gov
- Accessibility
- Privacy Statement